
Cost Reduction Strategies
October 5, 2026
Author: Dr. Changwook Han, Principal Analyst
Narrowing the price gap with LCD is essential to expanding the notebook OLED market. Gen 8.6 and oxide TFT can reduce manufacturing costs, while HMO TFT should be selectively applied where product requirements justify it. Further cost reductions should then be pursued through polarizer replacement and simplification of the emissive structure.
Notebook OLED panel shipments are projected to increase from 14.1 million units in 2026 to 22.5 million units in 2030. The CAGR is approximately 12.4%, with annual shipments expanding by 8.4 million units over four years.
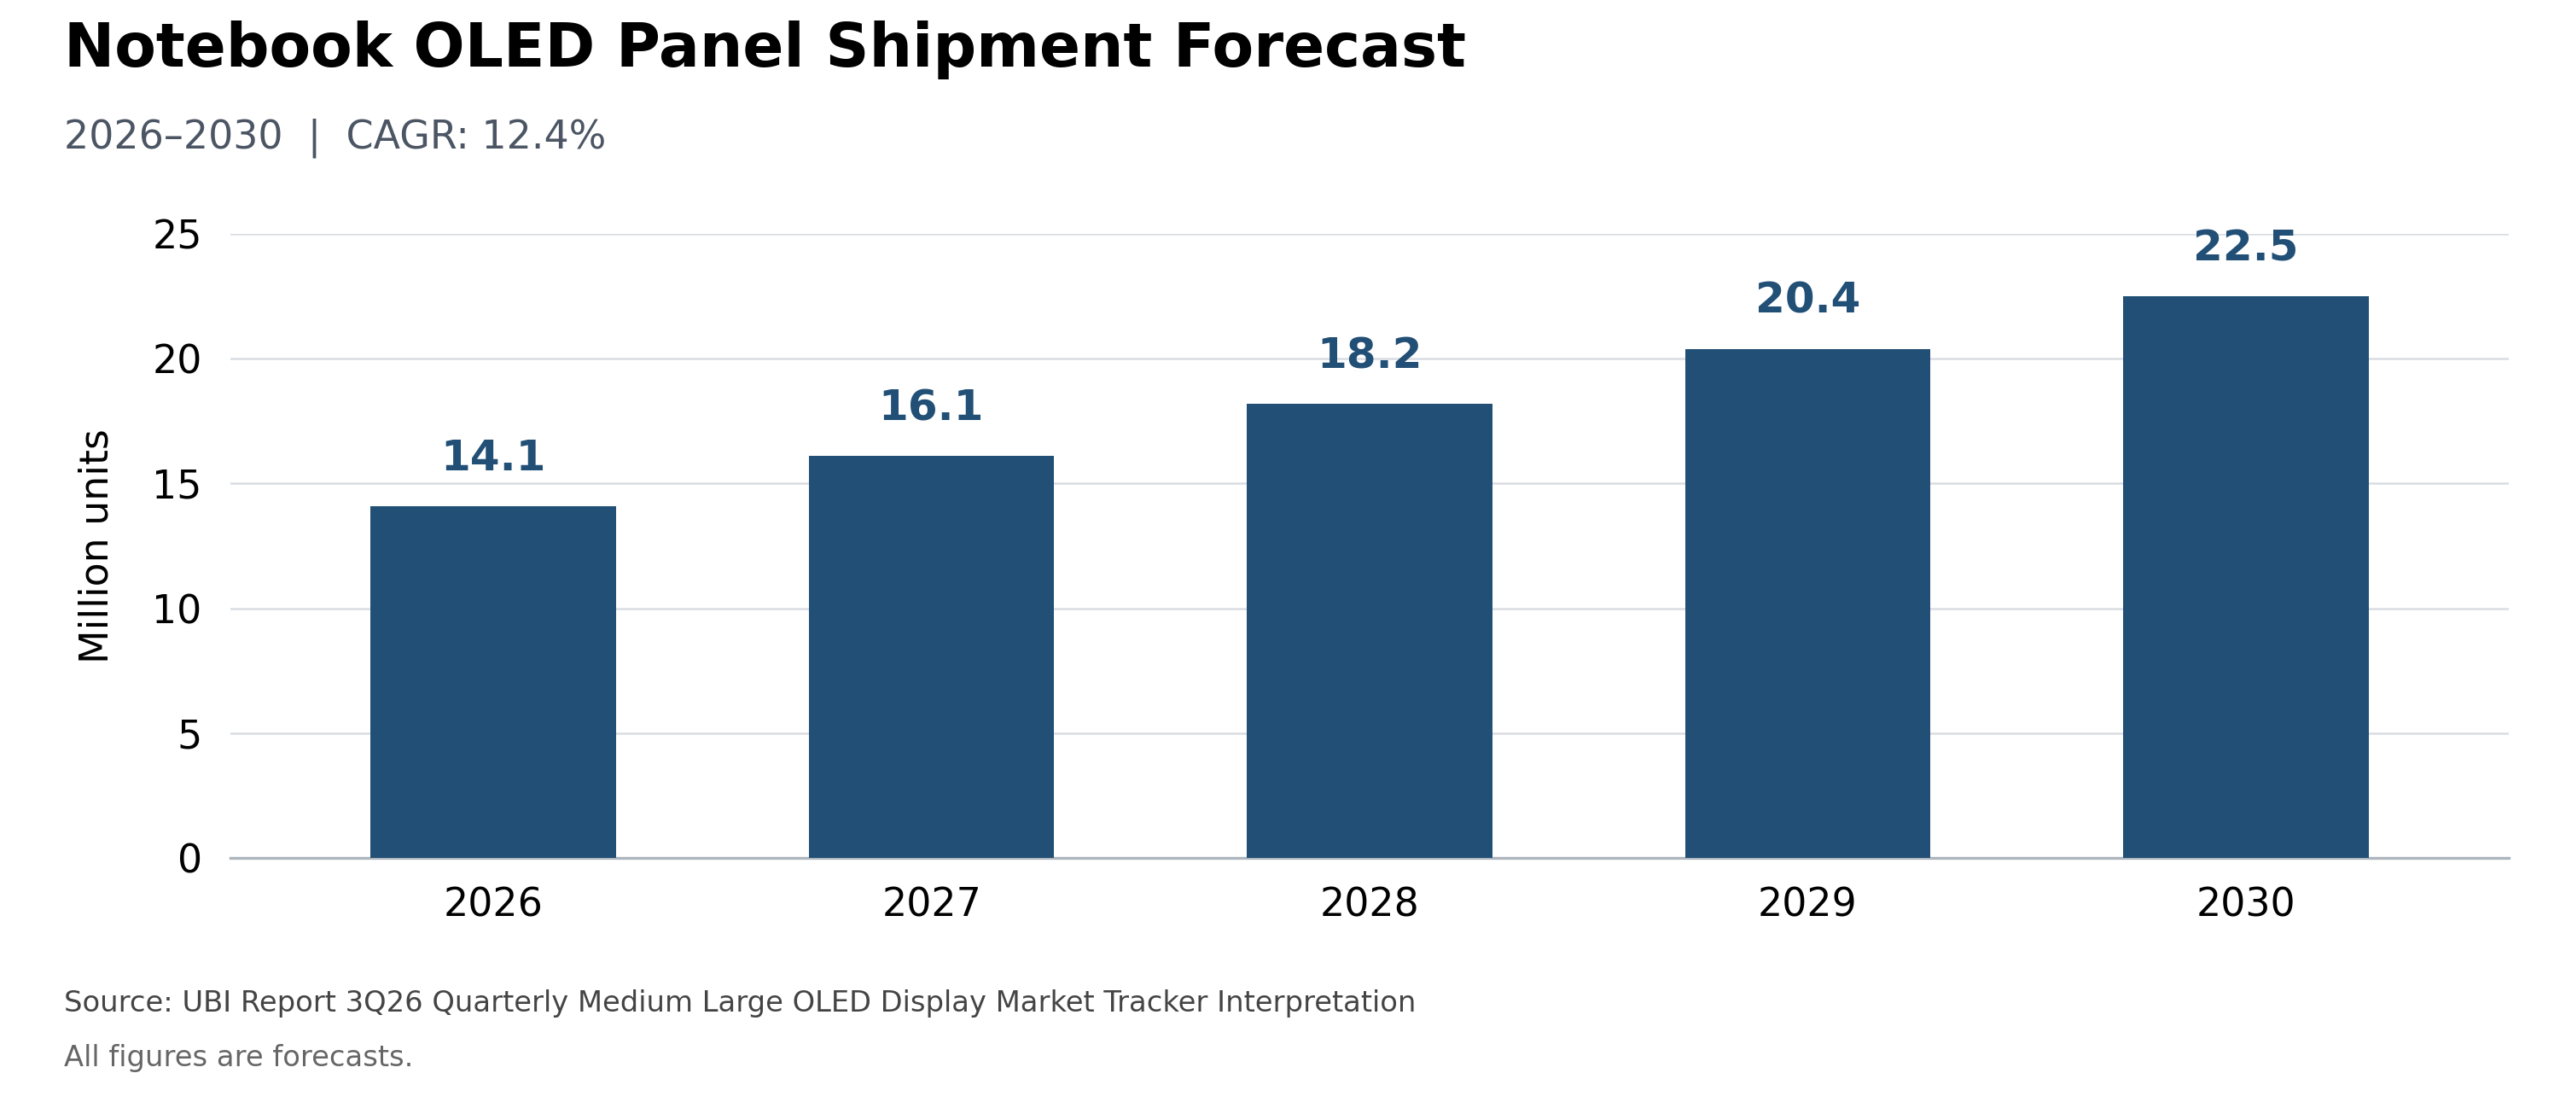
To realize this growth, adoption must increase in premium products while expanding into high-volume mainstream consumer models. For added production capacity to translate into shipment growth, pricing must enable OEMs to adopt OLED across a broader range of models.
OLED has primarily been adopted in premium ultralight, creator, and gaming products, and is also offered as an option in everyday product lines such as the ASUS Vivobook S14/S16. The next challenge is to expand both the number of adopted models and shipment volume.
This report analyzes the economics of larger substrates and oxide TFT, and proposes additional cost-reduction pathways through selective use of HMO TFT, COE, high-efficiency blue emitters, and long-lifetime RGB materials.
In smartphones, OLED adoption has been supported not only by image quality but also by product-design differentiation, including thinner structures, narrower bezels, curved displays, and foldable form factors. OLED has served as a means of changing both display performance and product appearance.
In conventional clamshell notebooks, the value of OLED’s contrast ratio, color reproduction, and fast response varies by use case. The difference is readily perceived in video production and gaming, while LCD can still satisfy major requirements for document work and web browsing. OLED therefore does not provide the same incremental purchase value to every consumer.
| Comparison Item | Smartphone | Notebook |
| OLED differentiation | Image quality and product design Form-factor innovation |
Image quality and response speed Thickness and weight improvement |
| Panel area | Relatively small | Larger area increases per-panel cost burden |
| Usage environment | Video, photos, apps, etc. | Video and gaming plus bright, static productivity screens |
| Competition within purchase budget | Importance of display and design | Competes with CPU, memory, battery, etc. for incremental spending |
| Key condition for adoption | Product differentiation and price competitiveness | Perceived value by use case and price gap vs. LCD |
Because notebook displays have a larger area, the absolute increase in panel cost associated with OLED is also important. If consumers can choose a higher-performance CPU or more memory within the same budget, image quality alone may not be sufficient to justify additional spending on OLED.
Power consumption must also be evaluated under actual usage conditions. OLED power depends on screen content, brightness, refresh rate, and emissive structure. Low-refresh-rate operation and tandem structures can improve efficiency, but any battery-life advantage in productivity use should be verified at the finished-product level.
Accordingly, broader notebook OLED adoption requires lowering the price burden while preserving performance value for each use case. The market position OLED achieved in smartphones should not be assumed to develop at the same pace in notebooks.
The strongest driver of notebook OLED market expansion is narrowing the price gap with LCD through cost reduction. In the mainstream consumer market, it is important to deliver image quality above a certain level at a reasonable price. To reach consumers with limited willingness to pay a premium for OLED, both panel supply prices and finished-product prices must be reduced.
Image quality, lower weight, and lower power consumption can reinforce purchase value, but in mainstream price bands the benefit must be large enough to offset the additional panel cost. For example, if battery life increases by 30–60 minutes while panel and driving-component costs rise by USD 4–5, OEM adoption incentives may remain limited. Lower power consumption alone is unlikely to justify a price premium.
| Market Expansion Driver | Primary Area of Impact | Report Assessment |
| Narrower price gap vs. LCD | High-volume mainstream consumer models | Core condition for market expansion |
| Image quality and fast response | Video, creation, gaming | Creates use-case-specific willingness to pay |
| Thinner and lighter design | Portability-focused products | Contributes to product-design differentiation |
| Lower real-world power consumption | Battery-focused products | Promotes adoption when verified at finished-product level |
The low leakage current of oxide TFT is advantageous for low-refresh-rate operation. Samsung Display has also demonstrated 1 Hz operation with UT One. However, if the cost of memory and other components rises, OEMs may adjust display specifications to balance the total BOM. The low-power advantage must therefore be assessed together with the finished-product price.
For analytical purposes, this report assumes OLED panel price premiums over LCD of 1.8–2.5× in the high-end segment, 1.5–2.0× in the premium segment, and 1.2–1.5× in the mainstream segment. These assumptions quantify the view that the acceptable premium decreases at lower price tiers; they do not represent transaction prices for any specific product.
In the mainstream market, the priority is to reduce the price premium while maintaining OLED’s fundamental image-quality advantage over LCD. Rather than applying high resolution or complex structures uniformly, performance requirements and cost should be co-designed for the intended use case.
Moving from Gen 6 to Gen 8.6 enables more notebook panels to be produced from the same number of mother-glass inputs. The example below assumes a 16-inch, 16:10 display and a deposition design in which the TFT mother glass is divided into halves. The active display area is approximately 344.6×215.4 mm; the layout pitch, including circuitry and cutting margins, is assumed to be 350×225 mm, with 10 mm excluded from each edge of the half substrate.
| Item | Gen 6 | Gen 8.6 |
| TFT mother-glass size | 1,500×1,850 mm | 2,290×2,620 mm |
| Deposition half-sheet size | 1,500×925 mm | 2,290×1,310 mm |
| Regular layout per half sheet | 4 columns × 4 rows = 16 | 6 columns × 5 rows = 30 |
| Designed panels per mother glass | 16×2 = 32 | 30×2 = 60 |
| Designed volume at 15,000 mother sheets/month (before yield) |
480,000 | 900,000 |
Under this regular layout, 16 and 30 panels can be designed per half sheet, or 32 and 60 panels per mother glass. With the same monthly mother-glass throughput and yield, output increases by 1.875×. The table is a calculation example rather than an actual mass-production take-out count or maximum layout. Results vary with bezel dimensions, the effective FMM area, cutting margins, and handling allowances. Good-unit output is obtained by multiplying the quantities above by the actual yield.
When larger substrates increase the number of panels per mother glass from 32 to 60, process and equipment costs can be distributed across more panels. As an illustrative calculation, assume that 60% of the existing manufacturing cost is scalable with production volume and that this cost per mother glass rises by 20% with the larger substrate. If the remaining 40% stays constant per panel and product structure and yield remain unchanged, panel manufacturing cost falls to 78.4% of the original level, corresponding to roughly a 20% reduction. This is an analytical assumption; actual savings will vary with cost structure, capital investment, utilization, and yield.
Excluding depreciation, oxide TFT may offer lower process and material costs than LTPS or LTPO TFT. However, a change from glass encapsulation to thin-film encapsulation (TFE) also changes encapsulation and module costs as well as investment requirements. TFT technology and encapsulation method are separate design choices and their cost changes should be calculated independently.
Source-driver cost can offset backplane savings. Depending on oxide transfer characteristics and driving conditions, more precise output-voltage control may be required. This report considers an increase from 8-bit to 9-bit or higher precision and a USD 4–5 increase in driving-component cost as a review scenario. This is separate from video color depth. Total net savings should be evaluated by subtracting net increases in driving, encapsulation, module, and depreciation costs from backplane savings.
The clearest value of HMO (High Mobility Oxide) TFT is the reduction of DeMUX circuit area. A DeMUX time-divides one source output across multiple data lines. Conventional oxide TFT can also implement this function, but lower mobility may require larger devices, creating constraints when fitting the circuitry within the bezel.
| Product Condition | Conventional Oxide TFT Response | Additional Value of HMO TFT |
| FHD / WUXGA class | DeMUX can be implemented | Limited additional cost benefit |
| Around 2.8K | Can address a substantial portion | Limited application benefit |
| 3.2K and above | Possible DeMUX-area and bezel constraints | Greater value from circuit miniaturization |
| 16-inch, high resolution | Potential increase in area and driving constraints | Evaluate potential to replace LTPS |
For comparison, this report assumes approximately 10 cm²/V·s for conventional oxide TFT and about 15–20 cm²/V·s for the early stage of high-mobility development. A mobility of roughly 50 cm²/V·s is considered a meaningful design target when aiming for DeMUX size and drive capability closer to LTPS. It is not an official classification or absolute threshold; actual circuit area depends on device structure, voltage, parasitics, and driving conditions.
If the additional driving margin provided by HMO is used for DeMUX and channel sharing, there is potential to reduce the number of external source ICs. An SEL oxide-TFT OLED patent states that sharing a source line between two subpixels can halve the number of ICs. This supports the concept of channel sharing, but does not prove that the effect is unique to HMO TFT.
If conventional oxide already achieves the same DeMUX ratio and bezel dimensions, the incremental cost benefit of HMO TFT is small. Conversely, if HMO can implement circuits that previously required LTPS because of high resolution, large display size, or narrow bezels, there may be economic value from replacing LTPS and simplifying the process. BOE research on OLED and LCD provides related reference cases.
For LTPO-based products in China, the process-saving potential of a full-oxide transition should be examined. For Samsung Display’s oxide-based products, HMO economics should be evaluated for specifications that are difficult to address with conventional oxide. HMO should not be generalized as the core cost-reduction technology for all notebook OLEDs.
The resolution categories and mobility levels are analytical criteria for comparing product-level economics. Actual results vary with refresh rate, interconnect load, compensation scheme, and bezel requirements. Company-specific directions are technology-application scenarios.
Notebooks, which are used predominantly indoors, are suitable candidates for evaluating polarizer replacement. COE suppresses ambient-light reflection with a color filter and black matrix above the encapsulation layer, thereby replacing the polarizer. Improved optical efficiency can also be expected, but reflection requirements under indoor lighting and near-window conditions must still be satisfied.
The net savings from COE equal the avoided polarizer and lamination costs minus color-filter process and material costs, yield loss, and additional depreciation. Fully depreciated equipment is favorable but does not guarantee savings. Depending on the difference in process and material costs and on good-unit output, savings may also be achievable before depreciation ends; investment payback should be evaluated separately.
Further notebook OLED cost reduction requires examining whether the tandem structure adopted for long lifetime can be replaced by a single stack. This requires higher efficiency and lifetime for high-efficiency phosphorescent or TADF-based blue emitters, while green and red materials must also achieve the lifetime required for notebook usage. The key is to reduce RGB degradation and suppress image sticking and white-point shift under prolonged display of bright document screens and static UI elements.
Combining improved RGB material efficiency and lifetime with the optical-efficiency gain of COE could reduce the drive-current burden and increase the possibility of meeting the required lifetime with a single stack. If these improvements satisfy notebook targets for brightness, power consumption, and service life, the additional emissive unit and charge-generation layer (CGL) required for tandem can be eliminated, reducing material and deposition-process costs. The development objective is to reproduce, through material and optical-structure improvements, the lifetime previously secured by tandem and translate that into the cost competitiveness of a single-stack structure.
Gen 8.6 → backplane optimization → simplification of optical and emissive structures represents the pathway to additional cost reduction. The key to mainstream market expansion is to realize a ‘minimum-required-performance OLED’ at low total cost while maintaining image-quality superiority over LCD and reliability for productivity use.
[1] UBI Report 3Q26 Quarterly Medium, Large OLED Display Market Tracker.
[2] ASUS, Vivobook S14/S16 Series M3407HA/M3607HA
[3] Samsung Display, COMPUTEX 2025 materials, UT One and oxide TFT.
[4] BOE, SID 2024, High-Mobility Oxide TFT for 14inch AMOLED Display.
[5] SEL, US20170170200A1.