
This Focus Pro draws on UBI Research’s report “2026 XR Display and Key Optical Components: Technology and Market Outlook” to set out where display, materials, and equipment companies can realistically expect volume, when it will arrive, and who is likely to capture it.
1. The Numbers Only Make Sense Once the Market Is Split
We divide XR devices into four non-overlapping classes by optical architecture and use case: VR and MR headsets (including puck-tethered VR and MR glasses), viewer-type AR glasses, see-through display glasses, and display-less AI glasses. As of 2026, display-less AI glasses are the largest class at about 10 million units, followed by VR and MR headsets at about 5 million, viewer-type AR glasses at about 1 million, and see-through display glasses at about 400,000 (Figure 1).
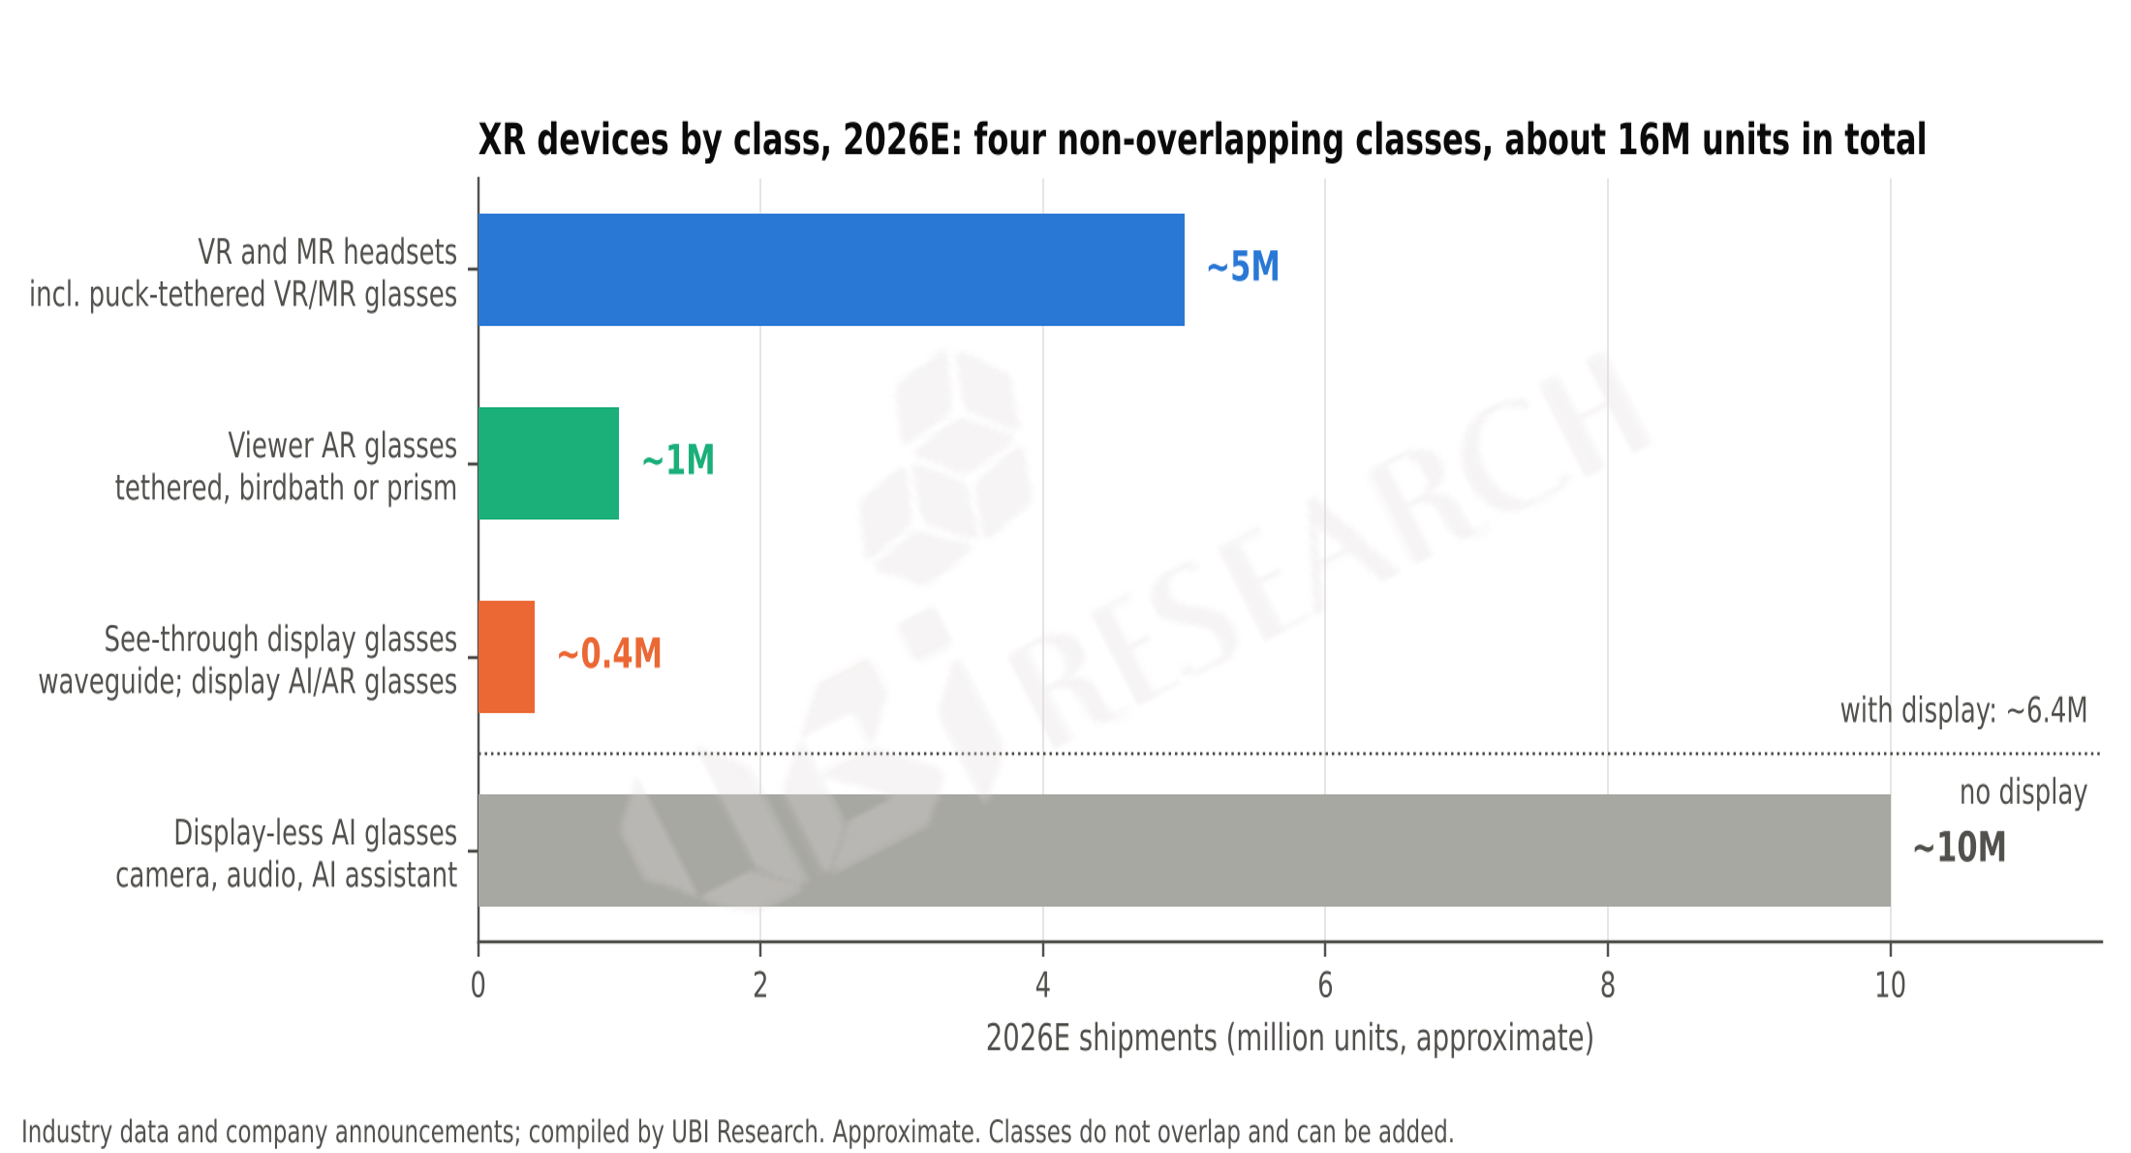
Figure 1. XR devices by class, 2026E
Source: Industry tallies and forecasts, company announcements; compiled by UBI Research. Figures are approximate; the four classes do not overlap.
This classification matters because the numbers most often cited in the industry bundle these four classes in different ways. “XR headwear” is headsets plus viewer-type glasses (about 6 million units), “display-equipped AR glasses” is viewer-type plus see-through glasses (about 1.3 million), and “AI glasses” is see-through plus display-less AI glasses (over 10 million). Because the same device falls into several tallies, adding these figures together or comparing them directly leads to a serious misreading of the market.
From a display maker’s perspective, the conclusion is simple. Even though the AI glasses market has grown quickly, about 96% of AI glasses shipped in the first half of 2026 have no display. Display demand comes from two places. One is the fast-growing display-equipped AR glasses segment; the other is VR and MR devices, whose unit volumes have fallen but which each use two panels of around 1 inch. Only by looking at these two markets separately does panel and wafer demand come into view.
2. AR Glasses: About 12 Million Units by 2030, with 2027–2029 as the Turning Point
Display-equipped AR glasses are still an early-stage market that has only just passed 1 million units a year, so published 2030 forecasts span more than threefold, from 10 million to over 30 million units. Forecasts diverge this widely because the market’s direction hinges on a handful of variables: when big tech launches display glasses, when retail prices reach the $400–500 range, when LEDoS moves from monochrome to color, and when battery and camera-privacy issues are resolved. Rather than offering a single number, we therefore built three scenarios, Bear, Base, and Bull, from combinations of these variables, and set out the conditions under which each would materialize (Table 1). The starting point is about 600,000 units in 2025 and about 1.3 million in 2026. The 2026 forecast stood below 1 million at the start of the year, then rose on expanded component orders for Meta Ray-Ban Display and growing shipments from Chinese brands. 2030 shipments are projected at about 8 million units in the Bear case, about 12 million in the Base case, and about 16 million in the Bull case (Figure 2).
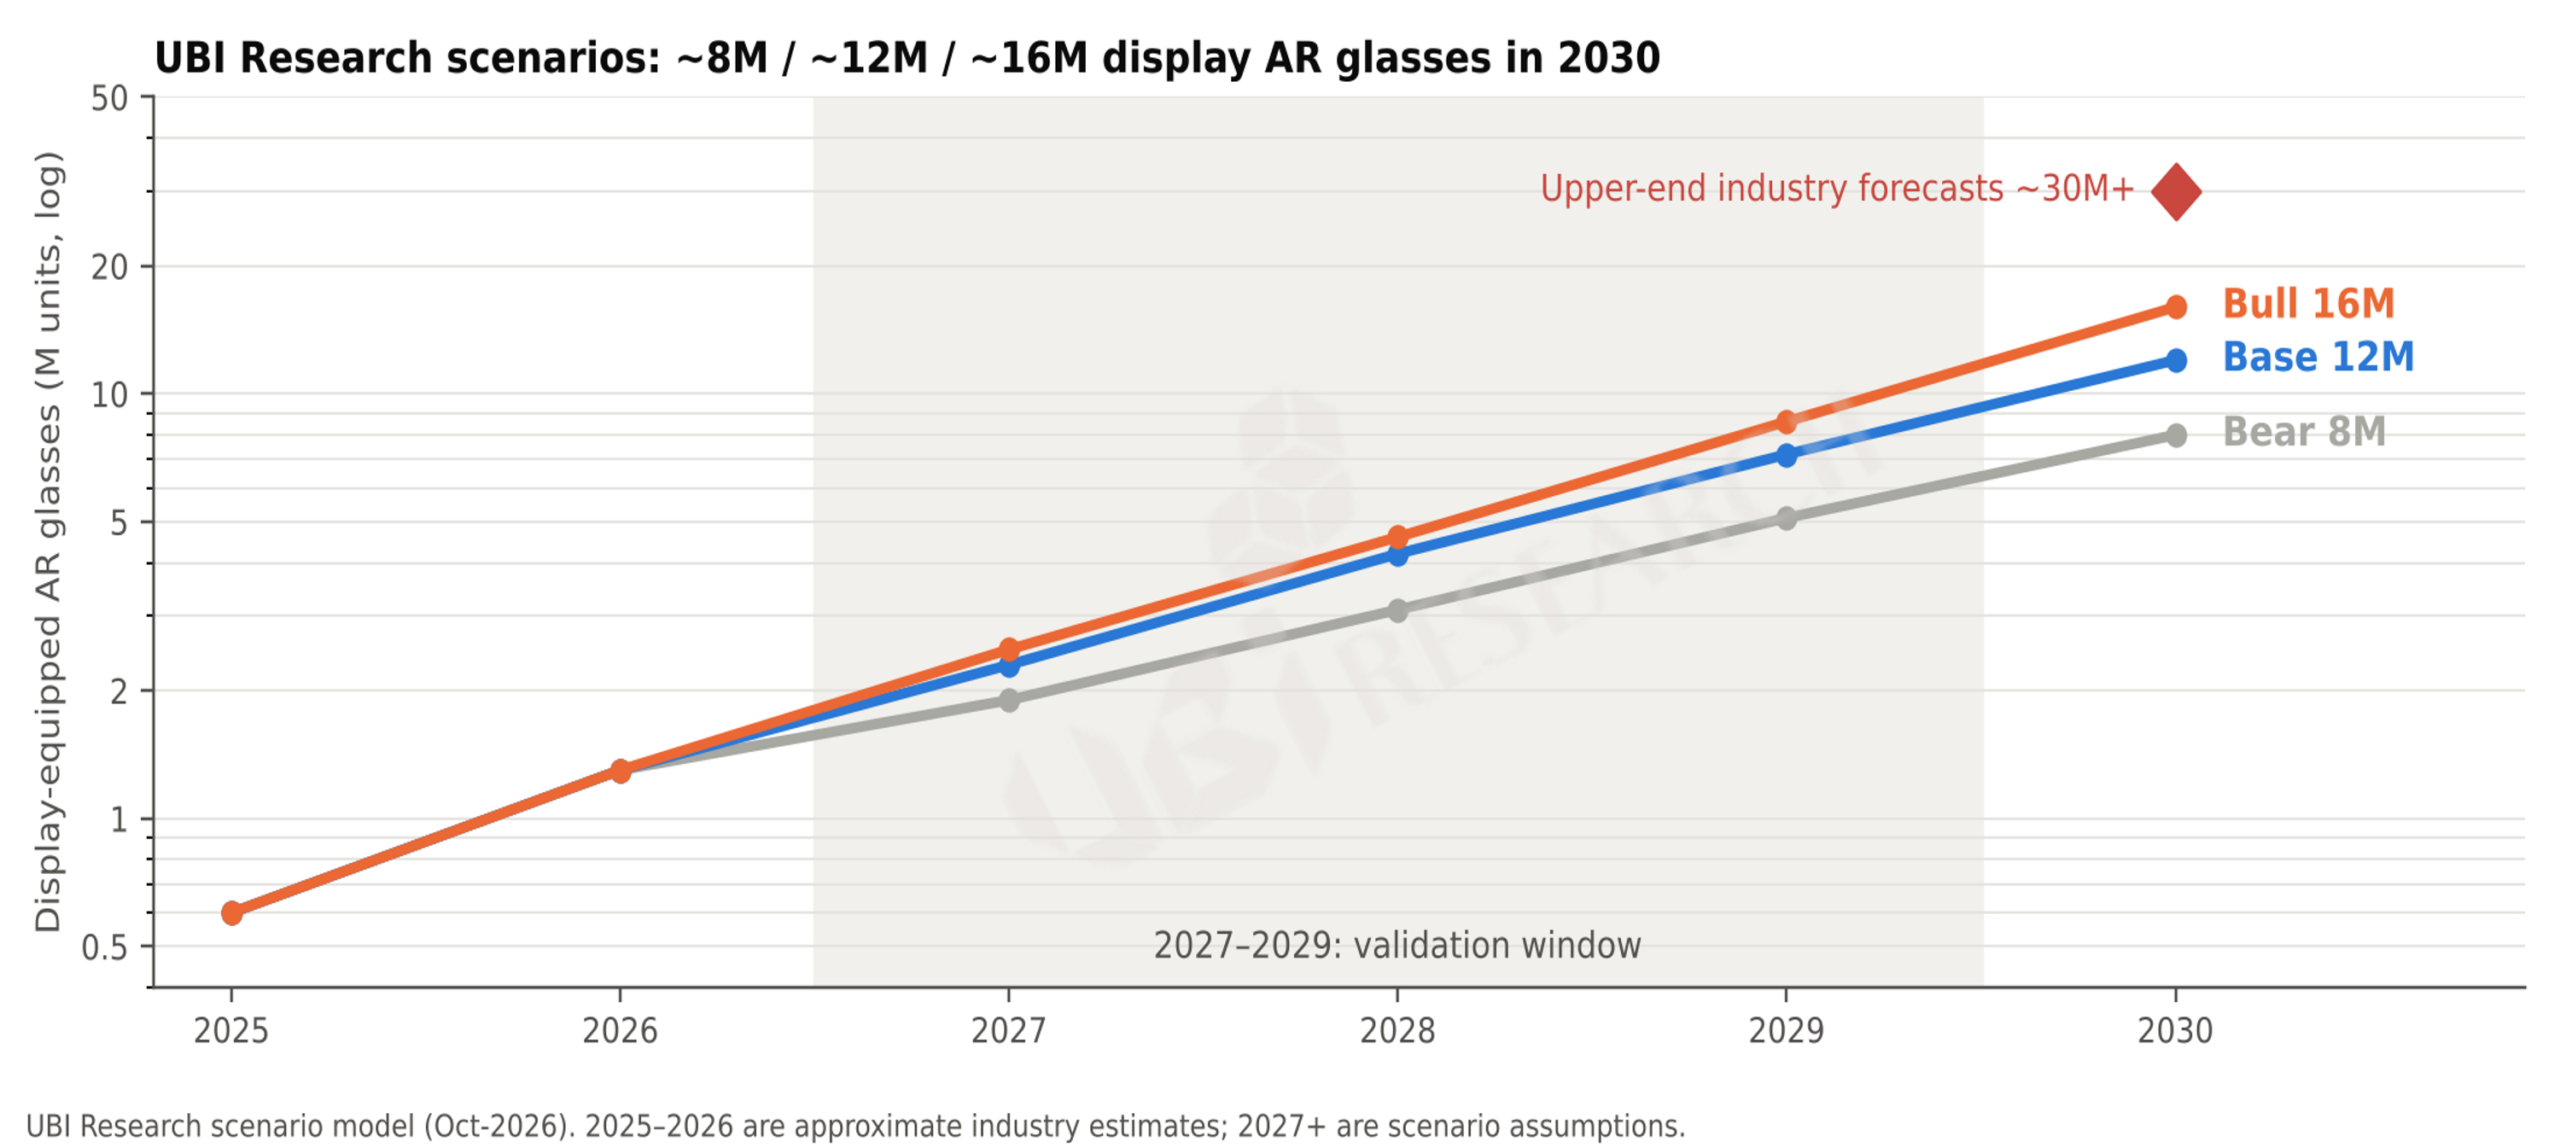
Figure 2. UBI Research scenarios for display-equipped AR glasses, 2025–2030
Source: UBI Research model (Oct. 2026). 2025–2026 are industry estimates (approximate); 2027 onward are scenario assumptions.
Table 1. Scenario assumptions for display-equipped AR glasses
| Variable | Bear (~8M) | Base (~12M) | Bull (~16M) |
| Big tech launches | Google and Samsung display products delayed to 2028 or later | Google and Samsung launch in 2027; Meta follow-ups roll out in sequence | Simultaneous launches in 2027; Apple display AR pulled forward |
| Retail price | Stays at $600 or more | Enters the $400–500 range in 2028–2029 | Entry-level models in the $300 range appear in 2028 |
| LEDoS color | Mainly monochrome | Two-color mainstream; full color in premium products | Full-color yield secured in 2028 |
| Battery and privacy | Issues persist | Gradual improvement | Resolved early; AI agents spread |
Source: UBI Research model (Oct. 2026).
All three scenarios see 2027–2029 as the period when the success or failure of full-scale growth becomes clear.
Converting to panels gives display makers a more direct picture. Microdisplay panels for AR glasses grow from about 1.7 million in 2026 to about 18.6 million in 2030 in the Base case. The share by technology shifts toward LEDoS, but OLEDoS panel volume still rises six- to ninefold, from about 700,000 to 4.5–6.6 million. The shift in share toward LEDoS is not a shrinking OLEDoS market but a difference in the growth rates of the two technologies.
The biggest risk separating the scenarios is dependence on a single product. The 2026 rebound in panel revenue, the LCoS share, and the upward revision of early-year forecasts all rest on one or two Meta products.
3. VR and MR: Fewer Units, but 80–90% of OLEDoS Wafers
The VR and MR headset market has contracted for four straight years. VR and MR device shipments in 2025 are estimated at about 5.5 million units, and total XR headwear shipments in the first half of 2026 fell about 40% year on year. Yet displays in high-end devices are converging on OLEDoS. Galaxy XR and Vision Pro use 1.3-inch-class OLEDoS, and Meta VR Glasses, Pico Space Pro, and Pimax Dream Air, launching in spring 2027, have also chosen Micro-OLED. Because OLEDoS panels are small, combining them with pancake optics can bring head-borne weight down to around 100–170 g. OLEDoS is being chosen not only for image quality but for weight reduction.
VR and MR devices are projected to bottom out at about 5 million units in 2026 and reach about 7 million in the Bear case, about 10 million in the Base case, and about 13 million in the Bull case by 2030. We expect the OLEDoS share to rise from about 12% in 2026 to 50% in 2030 in the Base case. In that case, OLEDoS panels for VR and MR in 2030 total about 10 million, more than for AR (about 6.5 million), and because these panels are larger, they account for about 86% of OLEDoS demand when converted to 12-inch wafers (Figure 3).
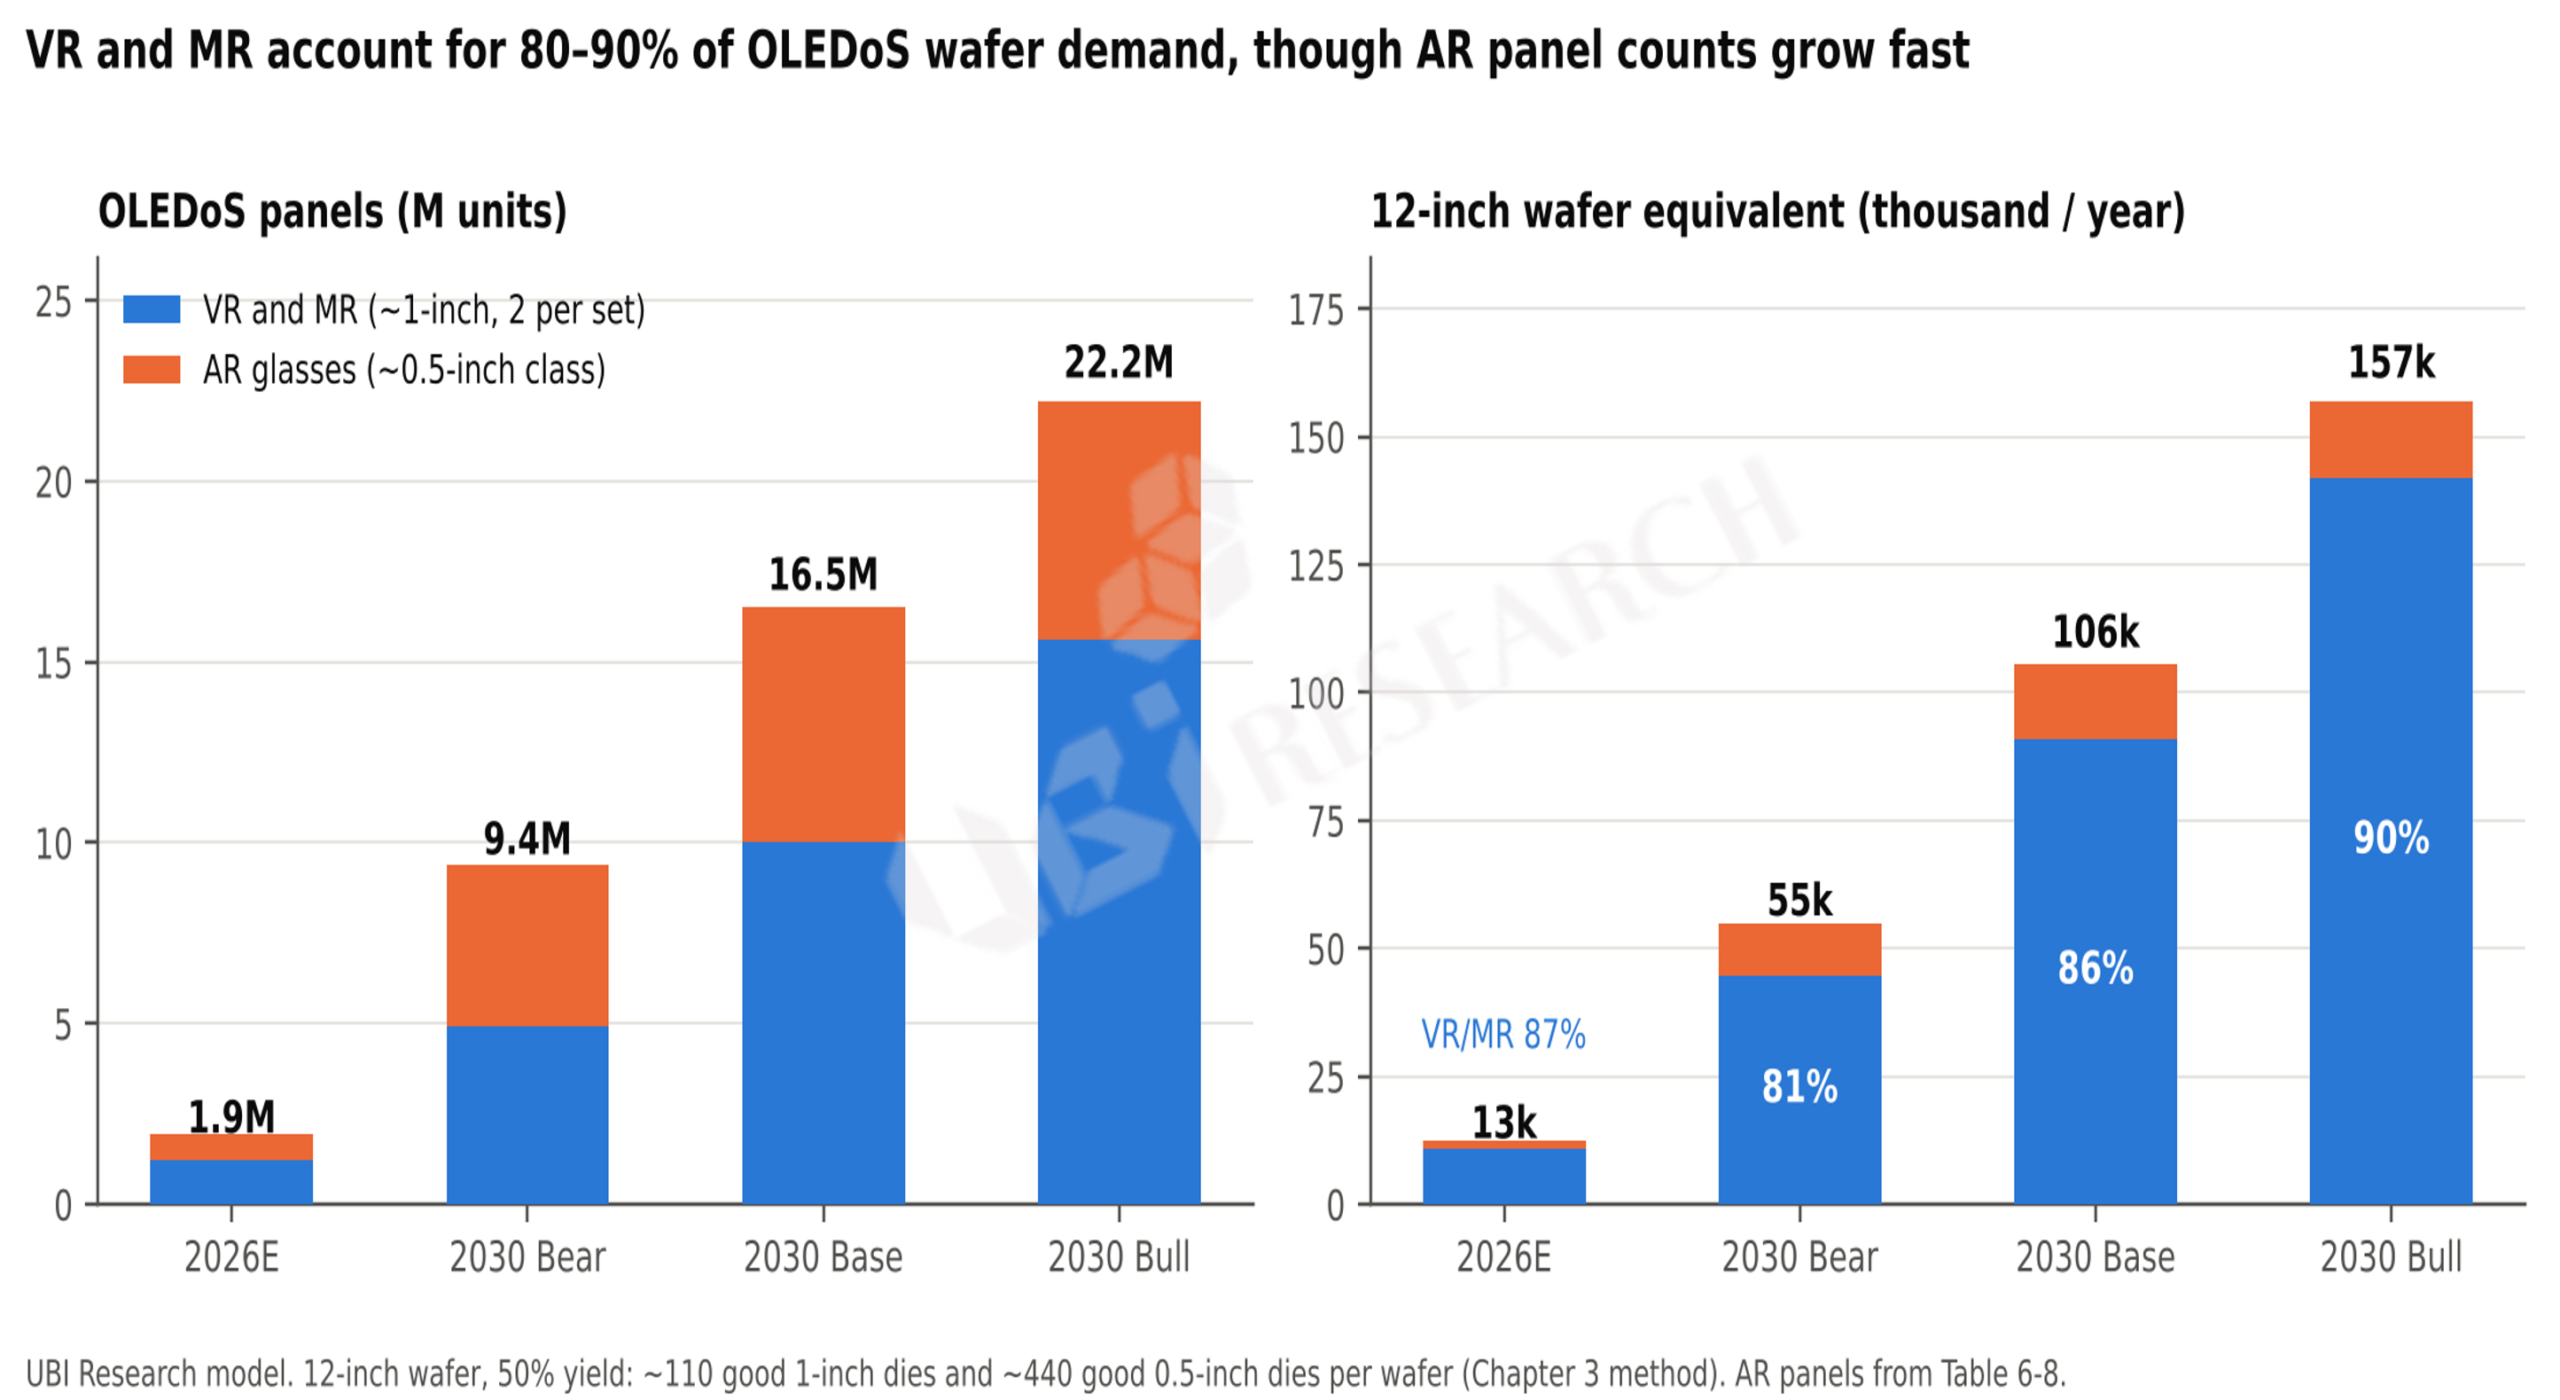
Figure 3. OLEDoS panel and wafer demand: VR and MR vs. AR glasses
Source: UBI Research model. Assumes 12-inch wafers at 50% yield: about 110 panels per wafer for the 1-inch class and about 440 for the 0.5-inch class.
This carries an important implication for the OLEDoS industry. Combined 2030 OLEDoS wafer demand from both applications is around 9,000 wafers per month in the Base case (about 5,000 in the Bear case and about 13,000 in the Bull case). By contrast, China’s 12-inch OLEDoS capacity is expected to grow from about 20,000 wafers per month across three companies to more than 50,000 per month across seven or more companies in 2027. Even if yields fall below 50% and more wafers are needed, the picture of capacity far outrunning demand does not change. Within the industry, too, some assess that China’s 12-inch capacity is running 1.5 to 2 years ahead of actual demand.
Over the next two to three years, therefore, OLEDoS is likely to see price competition and utilization competition at the same time. Panel makers’ utilization will depend more on the pace of recovery in VR and MR devices than on AR, and falling panel prices will in turn lower the price of OLEDoS devices, pushing up the OLEDoS share in VR and MR. It is a structure in which oversupply itself becomes a condition for demand expansion.
4. Roadmap: The Slowest Component Sets the Pace
Technology transitions in XR glasses do not happen just because one component’s specification improves. Even with full-color panels, low waveguide efficiency leaves too little luminance at the eye; even with smaller light engines, wear time stays short if battery capacity and SoC power cannot keep up. For color binocular AI glasses to enter the mass market, they must simultaneously meet a price of $400–500, a weight of 40–50 g, and a light engine of 0.2 cc or less, and 2027–2029 is the period that will test this. Table 2 sets out the conditions required for each major transition and the indicators that will confirm it.
Table 2. Technology transition gates and indicators to watch
| Transition | Condition to pass | Signal to watch | Earliest |
| Monochrome → color information display | Color light engine ≤ 0.2 cc and ≤ 200 mW; 500 nits at the eye with diffractive waveguide | Launch of mass-production products with two-color LEDoS | 2027–2028 |
| Monocular → binocular | Binocular alignment cost and yield; power within a 1 Wh battery | Binocular display AI glasses under $500 | 2027–2028 |
| W+CF → RGB direct patterning | Silicon mask durability; 12-inch yield | Mass production on a 12-inch RGB OLEDoS line | 2028 |
| 3-panel → single-panel full-color LEDoS | QD color-conversion reliability; red efficiency below 3 μm | Mass-production products with a single-chip full-color light engine | 2029–2030 or later |
| Glass → SiC diffractive waveguide | Cost of 12-inch optical-grade SiC; color uniformity | Consumer products with SiC waveguides | 2028 or later |
Source: UBI Research (Chapter 9 of the report). Timing is the earliest period in which the transition appears in mass-production products.
Overlaying the luminance roadmap with optical efficiency makes the technology boundary clear. The OLEDoS camp has set a target of raising full-color peak luminance from 6,000 nits in 2025 to 30,000 nits after 2030. Multiplying this panel roadmap by optical efficiency, OLEDoS combined with a geometric reflective waveguide (efficiency about 12%) crosses the daytime outdoor target of 1,500 nits at the eye around 2028. By contrast, combined with a diffractive waveguide (about 4% for an optimized design), it reaches only about 1,230 nits even assuming a 30,000-nit panel in 2030 (Figure 4).
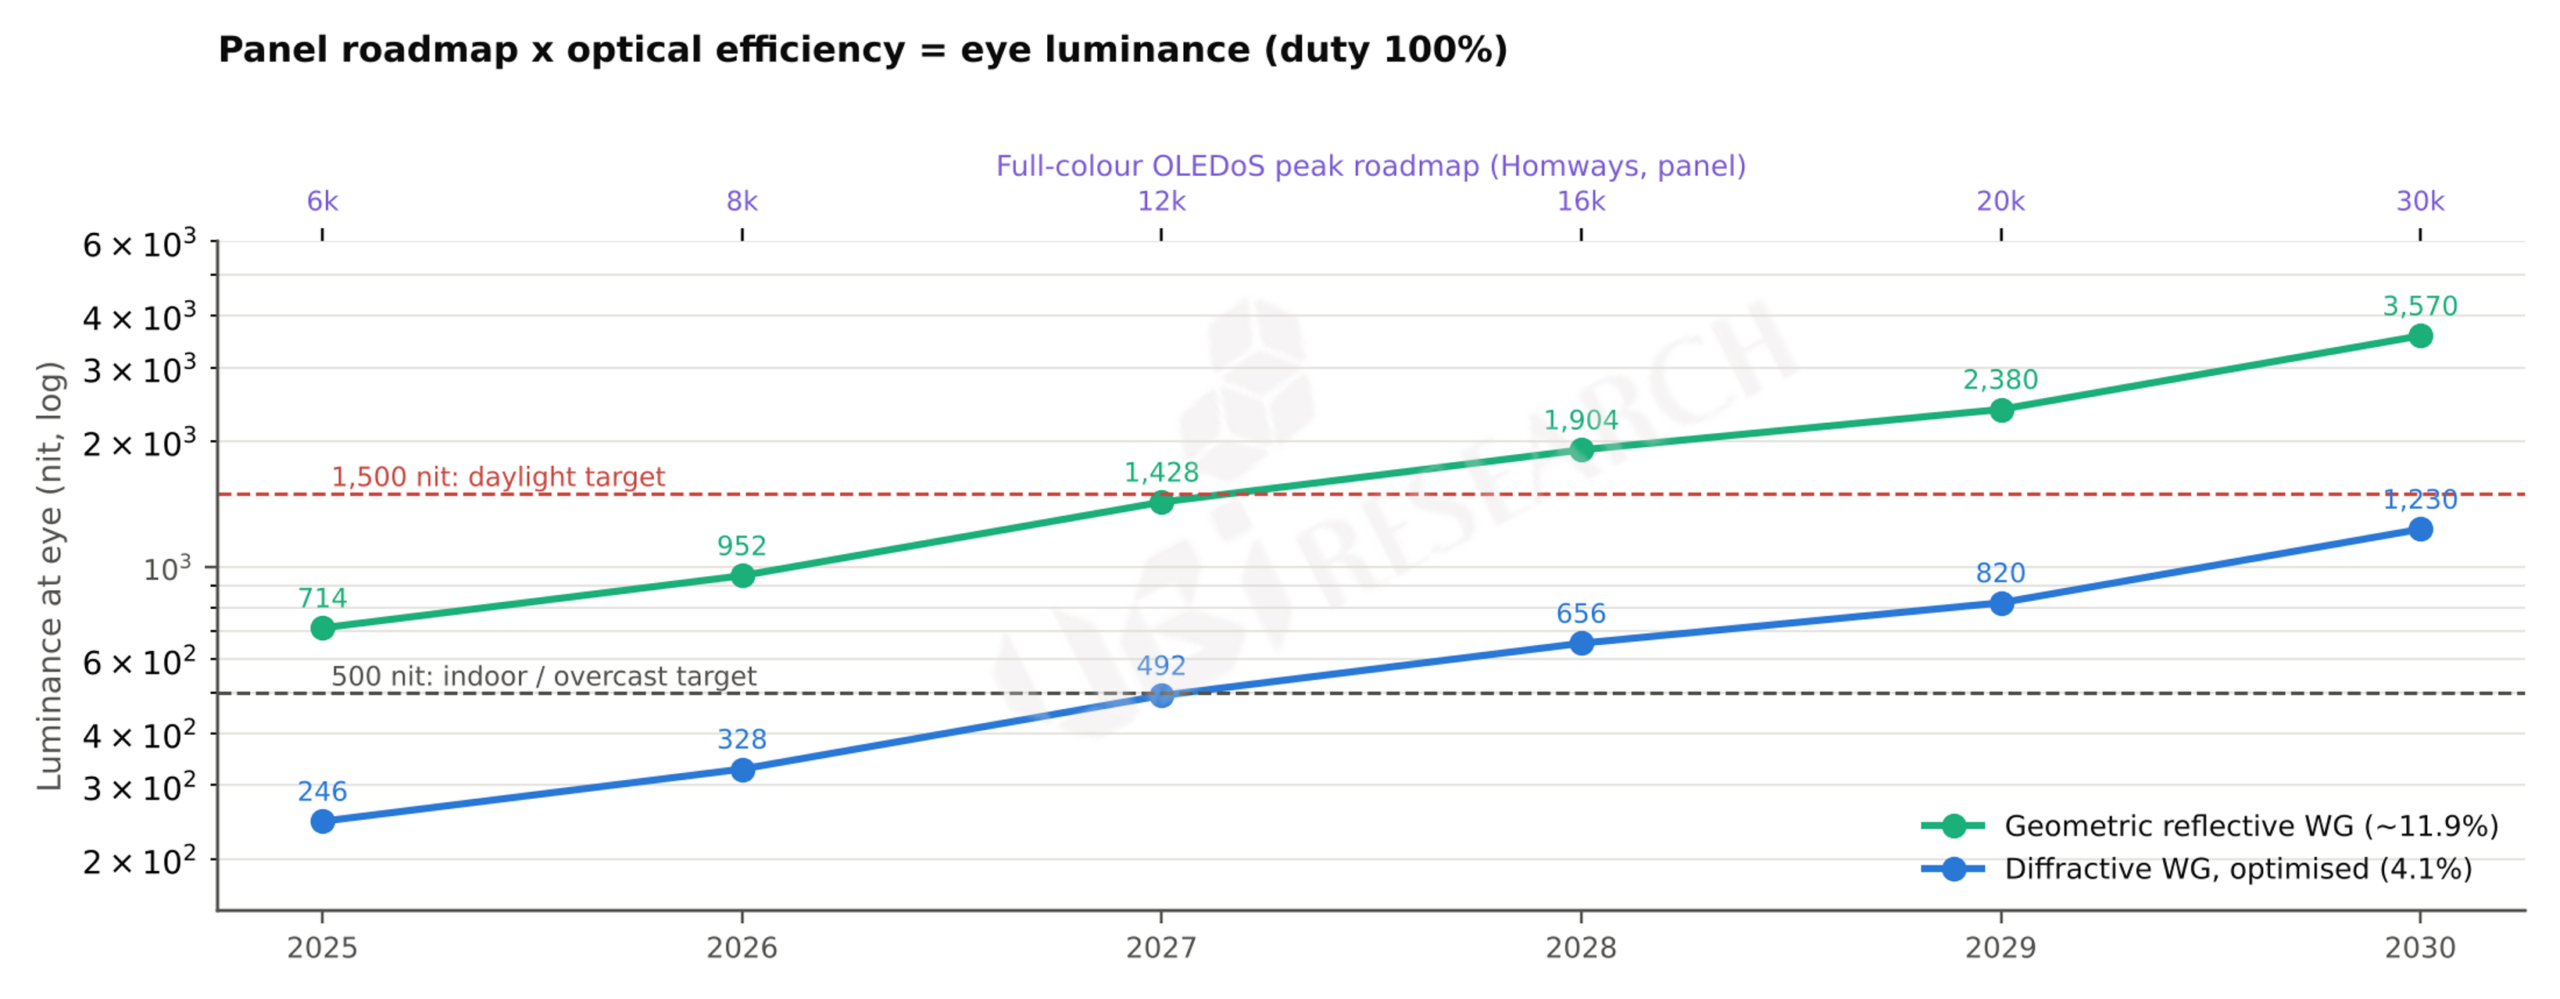
Figure 4. Eye luminance trajectory: OLEDoS peak roadmap × optical efficiency
Source: Panel roadmaps announced by vendors; UBI Research optical efficiency model. Based on 100% duty and panel peak luminance; actual continuous display luminance is lower.
Time will not resolve this boundary, because a diffractive waveguide is an optical structure that delivers only a few percent of the panel’s light to the eye. Crossing it requires one of three things: switching to LEDoS, which can deliver hundreds of thousands of nits or more; using a high-efficiency geometric waveguide; or lowering background brightness itself with electrochromic dimming. In the end, the future of XR displays should be read not as “which technology wins” but as differentiation by application. A division of roles is likely to persist through 2030: OLEDoS for viewer-type glasses and MR, LEDoS for see-through information display and AR, and LCoS for monocular color AI glasses and entry-level products.
5. Supply Chain: Half the Cost Is in the Display System, and China Is at the Center
The largest share of the cost of display AI glasses goes to the display system, which combines the panel, light engine, and waveguide. According to a teardown of Meta Ray-Ban Display, display-related components accounted for about 51% of the BOM for the glasses and Neural Band combined (Figure 5). This structure means two things. First, reaching the $400–500 price range is essentially a question of light engine and waveguide cost. Second, in glasses without a display, the SoC, cameras, and battery dominate the cost, but the moment a display is added, half the cost shifts to the optics. This is why display attach rates must rise for display and optics companies to benefit from the growth of AI glasses.
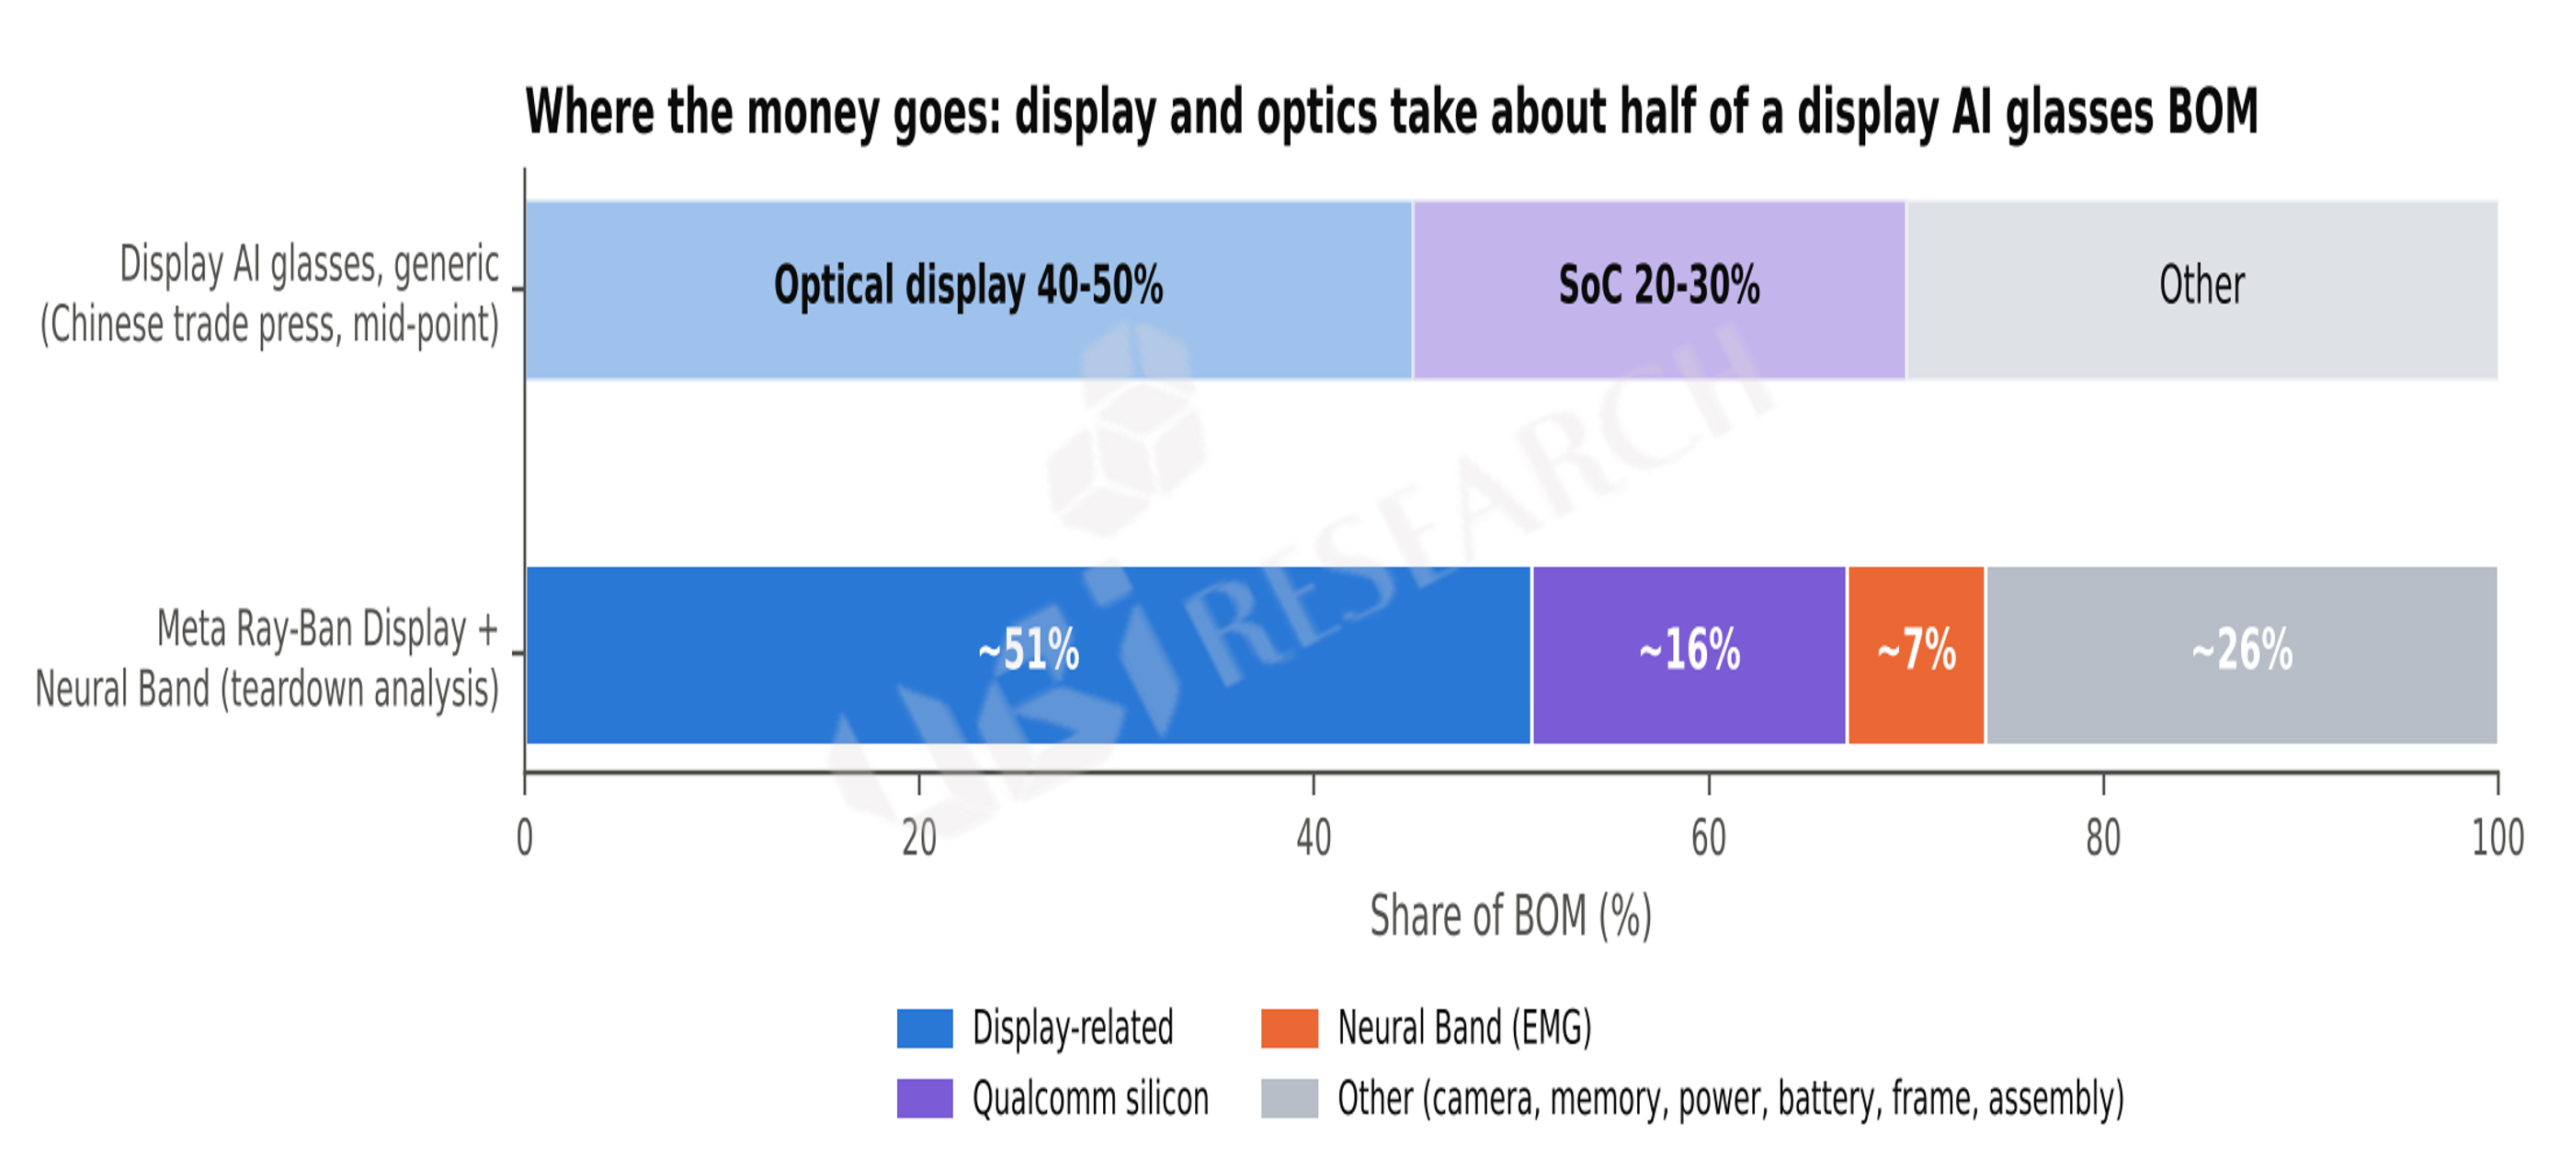
Figure 5. BOM share of display AI glasses
Source: Product teardown (Jun. 2026); midpoints of ranges reported in Chinese industry media. Figures are approximate.
Two models compete in the supply chain. The Chinese model vertically links panels, light engines, ODM, and finished products within a single region or company, gaining fast launches and mass-production learning. In the global model, big tech defines the product and picks the most advanced specialist at each layer. Meta Ray-Ban Display brought together a US SoC and LCoS, Israeli waveguide technology, assembly by a Chinese ODM, and a European frame. Each layer can use best-in-class components, but a bottleneck at a single supplier holds back the whole. In fact, when US demand outstripped supply, the overseas launch planned for early 2026 was postponed.
It has also become clear that production capacity and customer qualification are separate matters. For the OLEDoS in Meta’s next-generation MR glasses, joint supply by two Chinese makers was initially discussed, but one reportedly failed supplier qualification and the other began supplying. Even a company with a 12-inch line can fail big tech qualification. Suppliers should be evaluated not by capacity but by customer qualification and actual shipments.
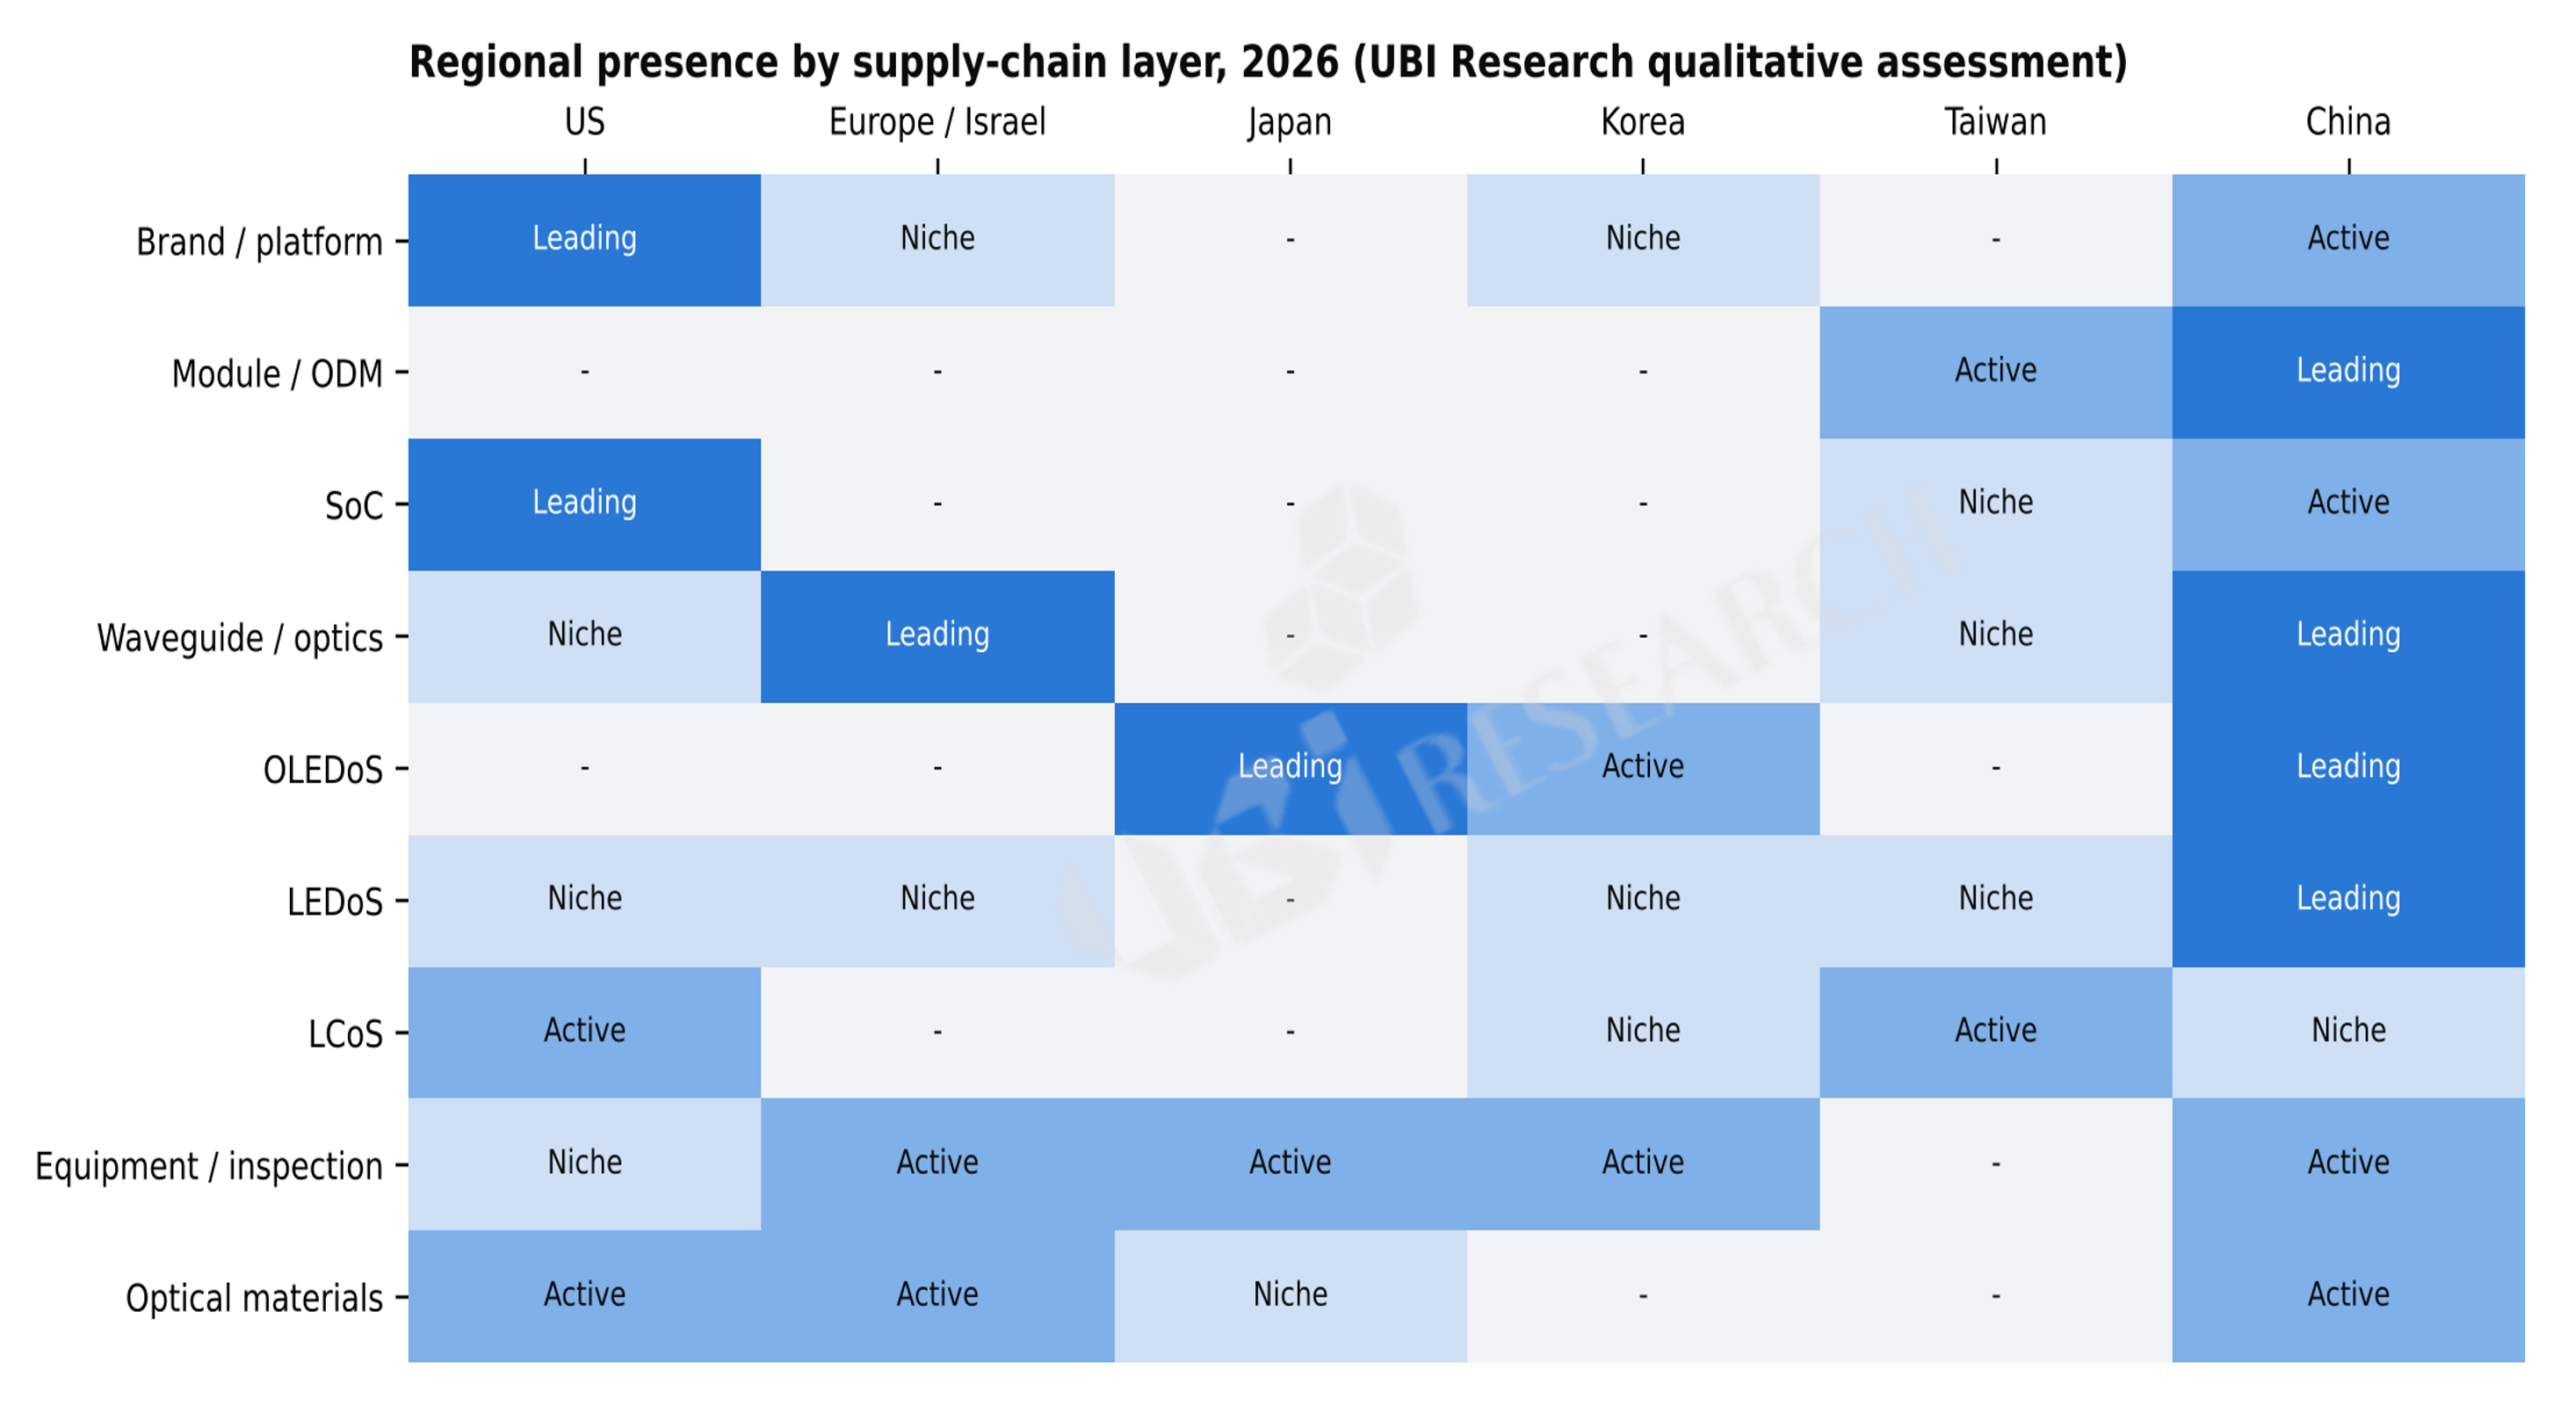
Figure 6. Regional presence by supply-chain layer, 2026
Source: UBI Research qualitative assessment. Based on disclosed supply records and announcements; not revenue share.
By region, China has companies in almost every layer: modules and ODM, waveguides, OLEDoS, and LEDoS. About 45% of display-equipped glasses shipments come from China, and many of the top brands are Chinese. The US is strong in brands, platforms, and SoCs; Japan in high-end OLEDoS and equipment; and Europe and Israel in waveguide technology and materials. Korea has a presence in OLEDoS panels and in deposition and mask equipment, but is almost invisible in the waveguide, light engine, and ODM layers (Figure 6).
6. Options for Korean Companies and Indicators to Track
Competing on panels alone, it is hard to stand up to China’s capacity and cost, and the center of actual demand also lies with Chinese brands. There are three areas where Korean companies can secure positions that are hard to replace.
- Panels with demanding processes. RGB direct-patterned OLEDoS is a decisive milestone that eliminates color-filter loss and raises the luminance ceiling. Investment in a 12-inch RGB line (3,000 wafers per month, targeting mass production in 2028) has reportedly been under review, and an ecosystem for deposition equipment and silicon-based masks already exists in Korea.
- Inspection, metrology, and alignment equipment. As China adds 12-inch fabs and waveguide lines, demand grows for AOI, coordinate-based data linkage, six-axis active alignment, and near-eye image quality metrology. This is both a bottleneck to scaling mass production and an opportunity for new entrants.
- System evaluation standards and reference modules. There is still no common industry method for measuring eye-position luminance, nits/lm, and system power. Measurement standards and certification, along with reference modules for display and optics co-design, are areas with a large first-mover advantage.
Conversely, the gaps in the waveguide, light engine, and ODM layers make it hard for display companies to offer system-level proposals. The priority is to build a co-design framework with optics companies in Korea and abroad, and to gain volume experience by securing either partnerships with Chinese brands or entry into big tech products in 2027. The indicators that will confirm the market’s direction over the next one to two years are shown in Table 3.
Table 3. Indicators to track in 2026–2027
| Area | Indicator | Why it matters |
| OLEDoS | Wafer starts, yield, and utilization after 12-inch lines light up; number of lines above 50% utilization | Whether China has overcapacity; panel prices |
| RGB OLEDoS | Confirmed investment in 12-inch RGB lines and equipment move-in | OLEDoS luminance ceiling and range of applications |
| LEDoS | Launch of mass-production products with two-color LEDoS; full-color wafer yield | Speed of transition in mainstream AR technology |
| Waveguides | Actual shipments and yield by customer SKU; nits/lm at target FOV | Gap between capacity and actual demand |
| Finished products | 2027 display product schedules and prices from Meta, Google, and Samsung | Conditions for the Base case to hold |
| VR and MR | Sales of Meta VR Glasses and next-generation Quest; OLEDoS adoption rate | 80–90% of OLEDoS wafer demand |
| Modules | AA cycle time, binocular alignment yield, equipment orders | Module cost and pace of scale-up |
Source: UBI Research (Chapters 6, 9, 10, and 11 of the report).
In conclusion, competition in XR displays has shifted from “which panel is brighter” to “which system delivers enough light to the eye with the least power and weight.” Through 2030, the center of volume will be OLEDoS for VR and MR, together with the display AR glasses market that opens up in 2027–2029. Leadership in capturing that volume will be decided less by panel specifications than by customer qualification, repeatable yield, and system integration capability.
*This article is based on Chapter 6 (Market Trends and Outlook), Chapter 9 (Technology Roadmap), and Chapter 10 (Supply Chain and Key Companies) of UBI Research’s report “2026 XR Display and Key Optical Components: Technology and Market Outlook” (Nov. 2026).